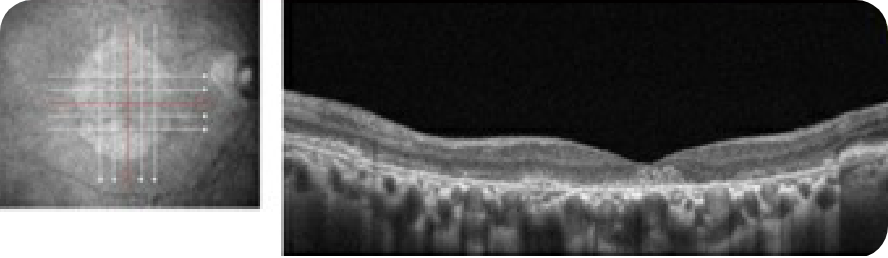
Optical Coherence Tomography (OCT) B-scan
Healthy OCT B-scan
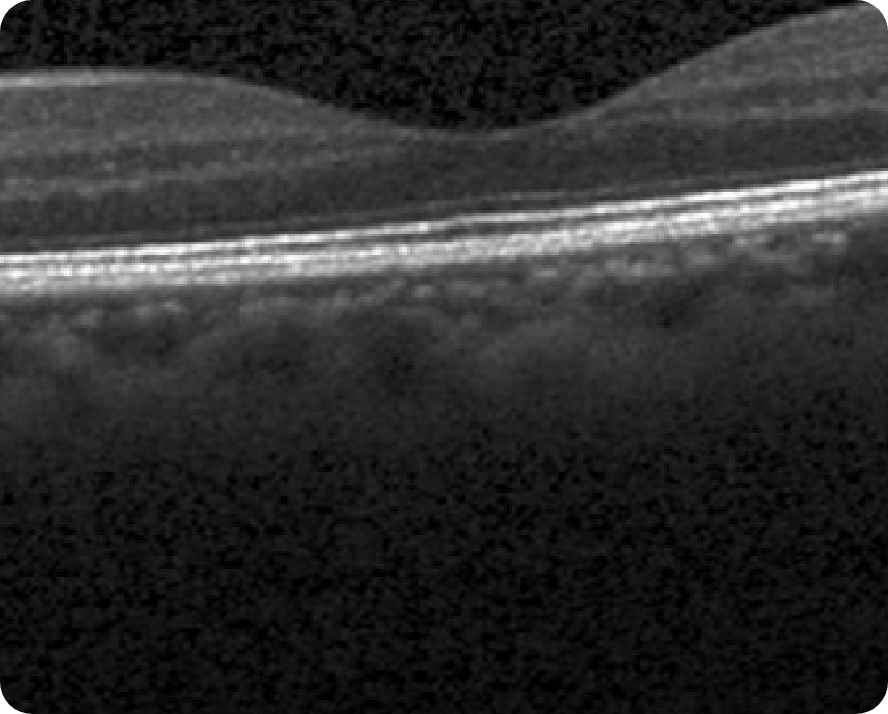
© 2022. This work is licensed under a CC BY 4.0 license. “Automatic detection of age-related macular degeneration based on deep learning and local outlier factor algorithm”, "Figure 5A", He T, Zhou Q, Zou Y. Diagnostics (Basl).
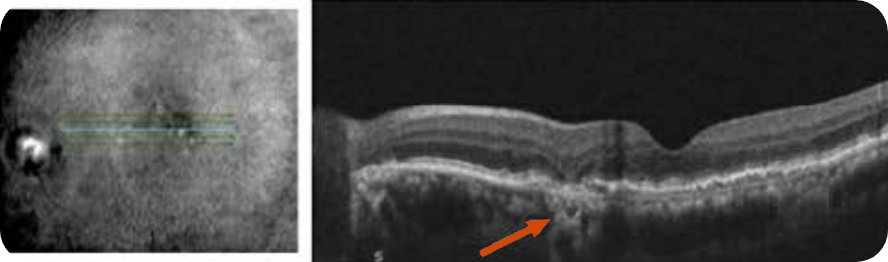
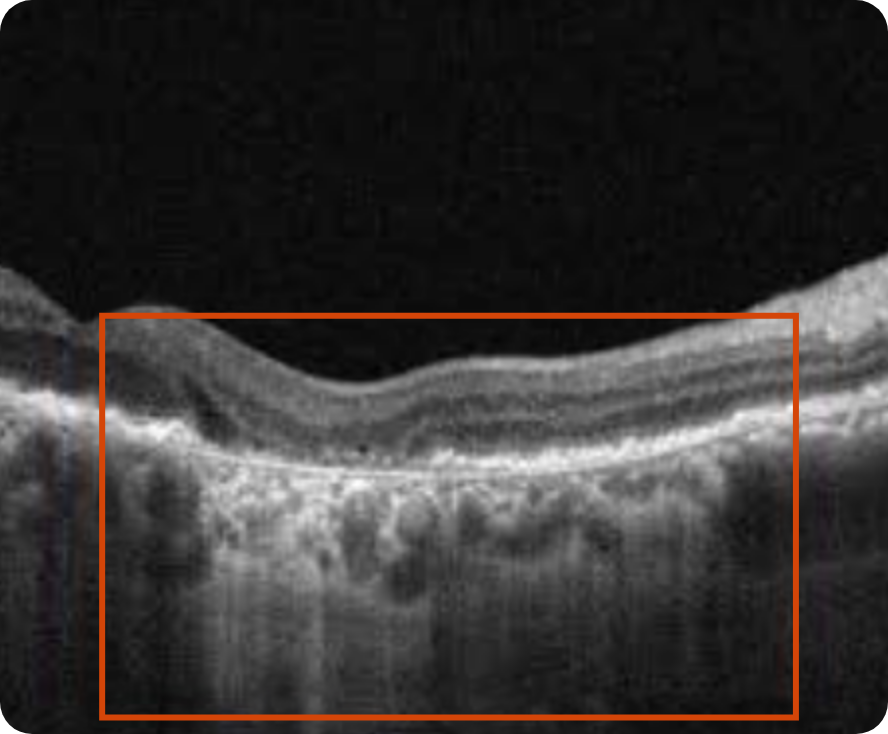
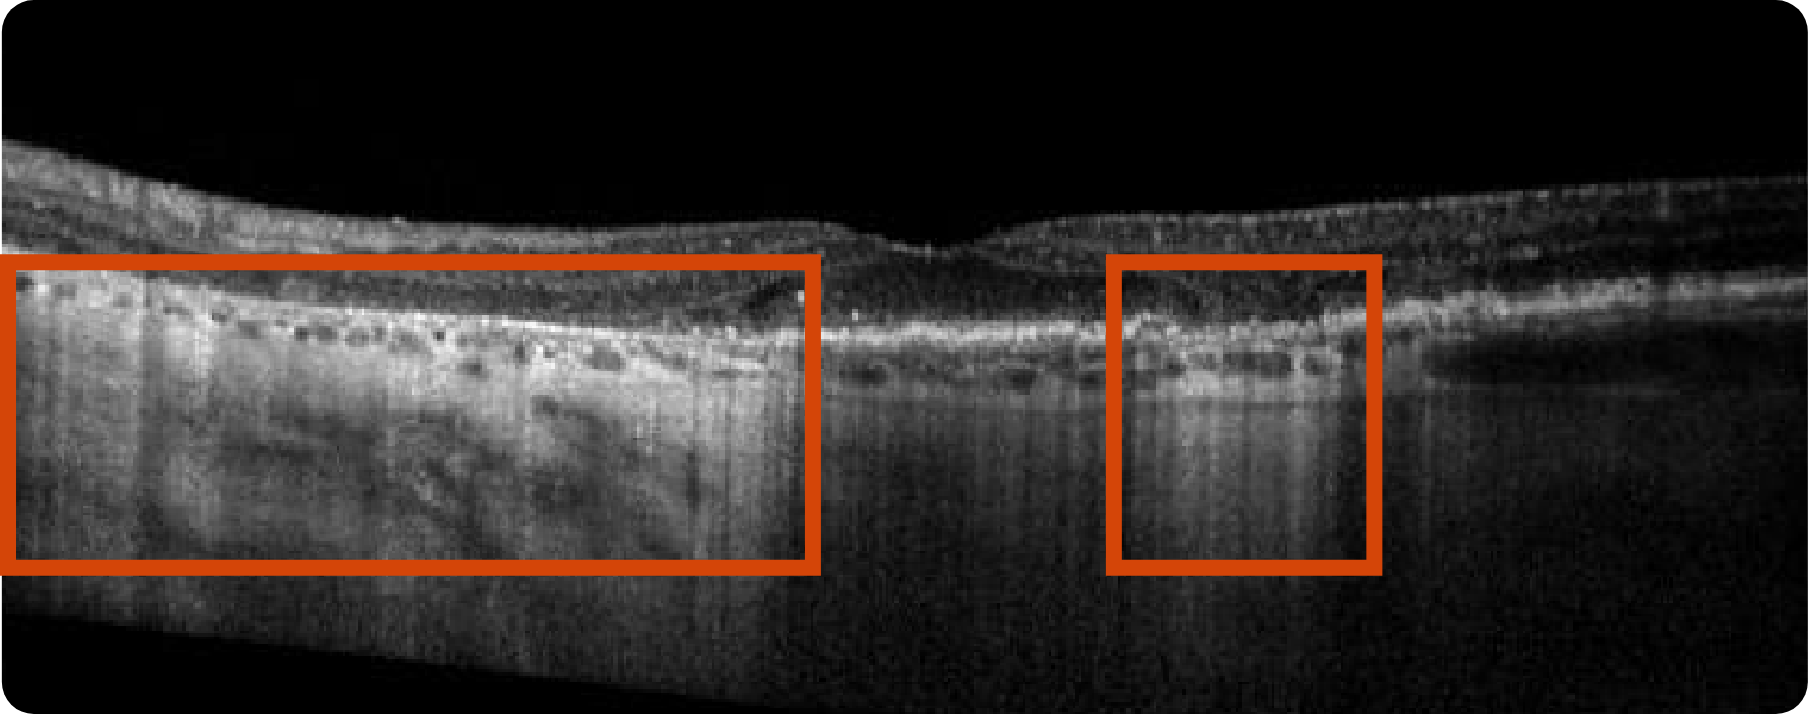
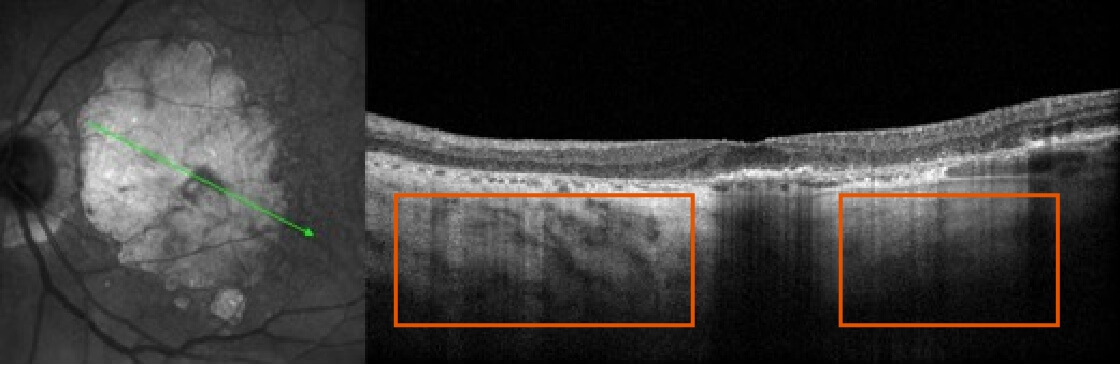
Abnormal OCT B-scan Image 1
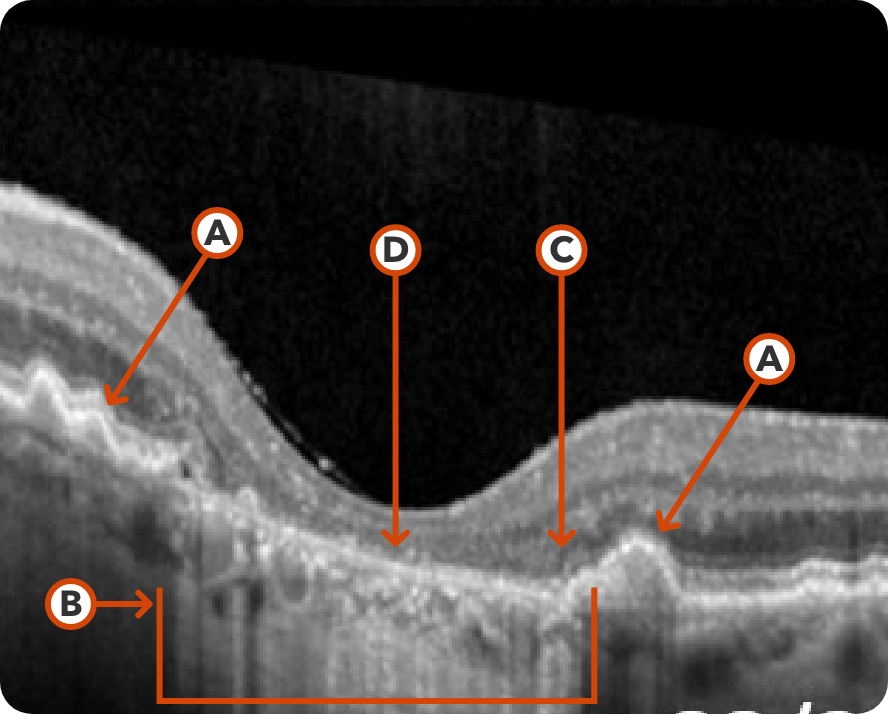
Reproduced from "Prognostic value of intermediate age-related macular degeneration phenotypes for geographic atrophy progression," Thiele S, Nadal J, Pfau M, et al, 2021;105(2):239-245, with permission from BMJ Publishing Group Ltd.
Drusen8
Choroidal hypertransmission8
Loss of RPE and photoreceptor layers8,9
Collapse of PED leading to atrophy as shown by hypertransmission8,9
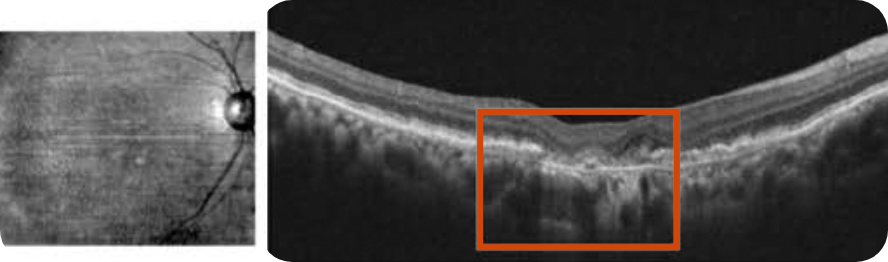
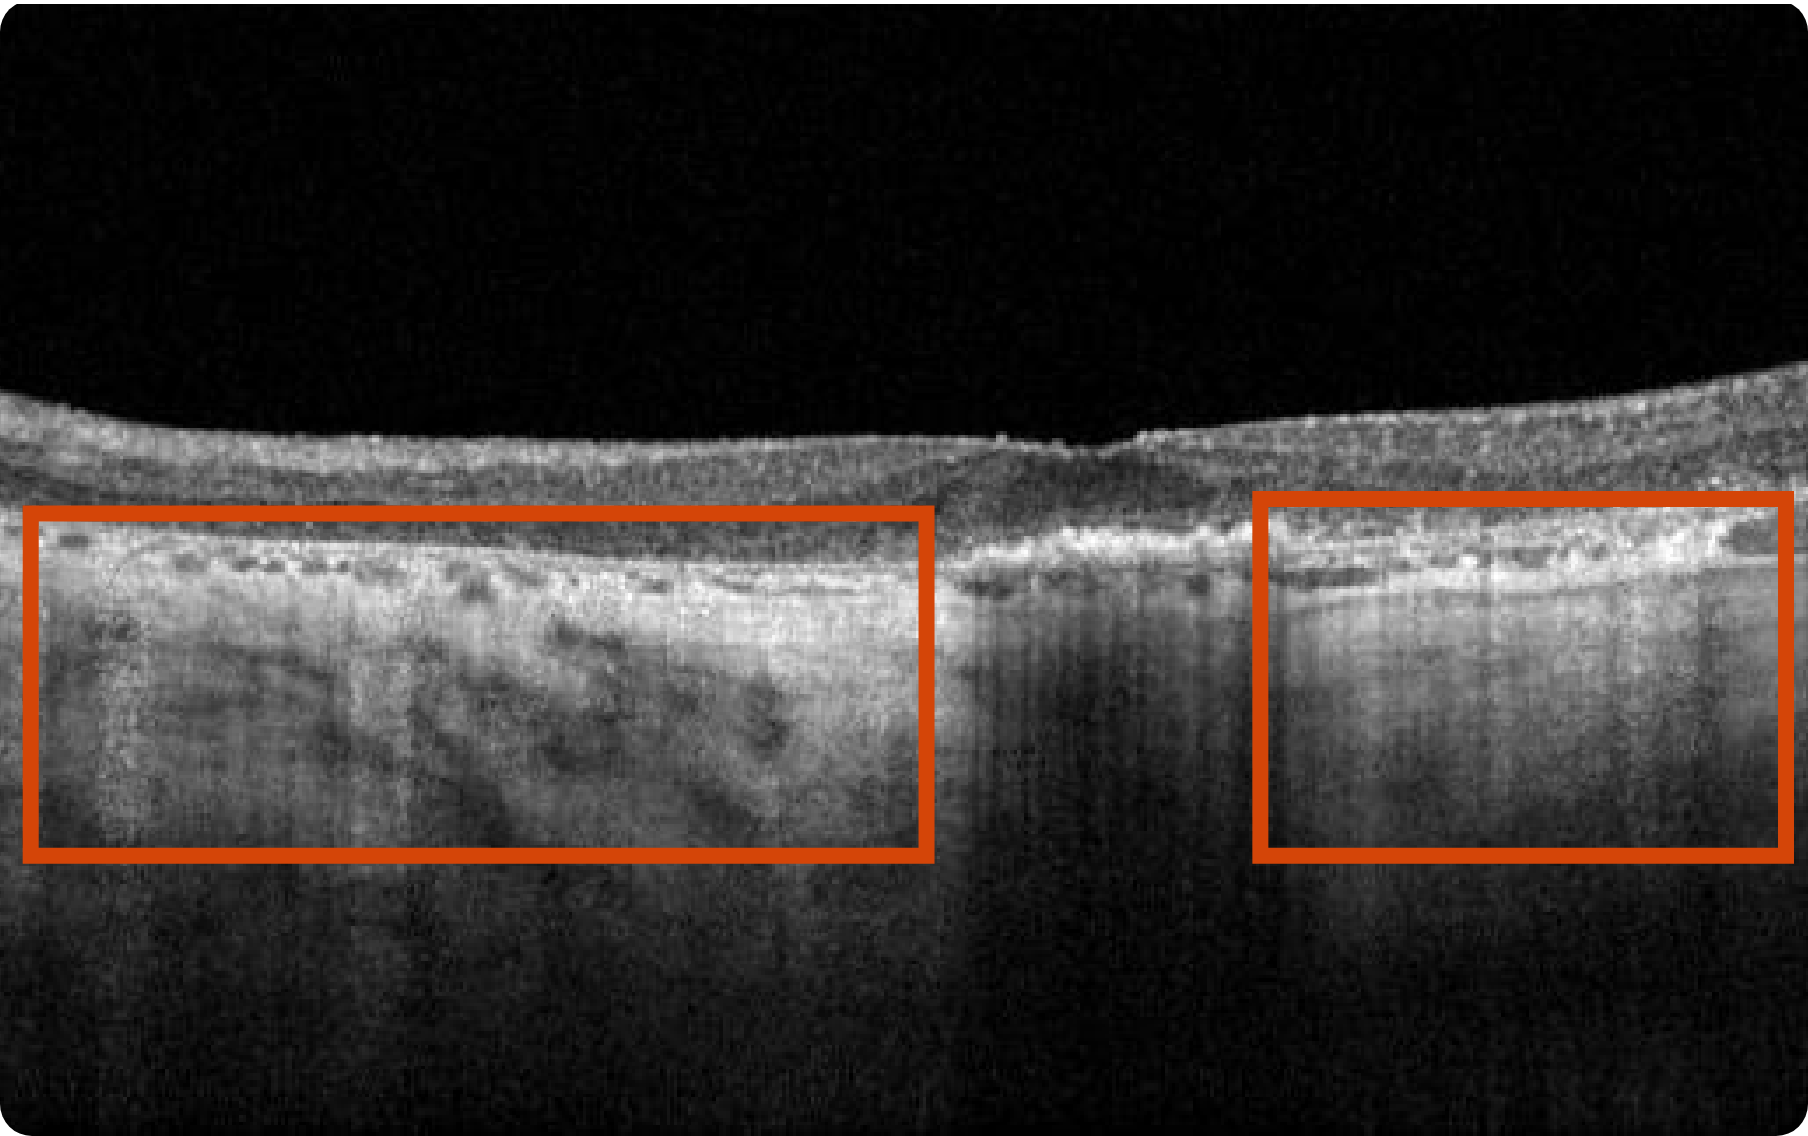
Abnormal OCT B-scan Image 2
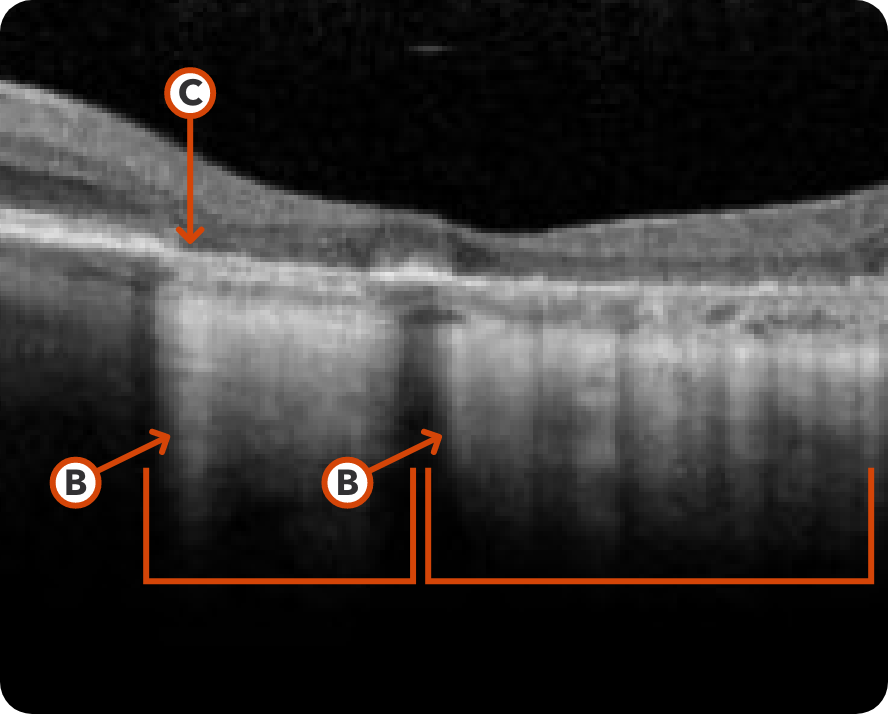
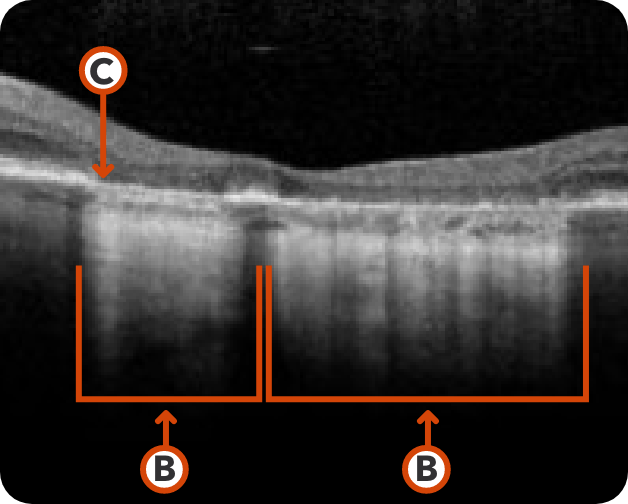
Image courtesy of Mohammad Rafieetary, OD, Charles Retina Institute.
Hypertransmission seen in GA7
Loss of photoreceptor as well as RPE and choriocapillaris layer7
Images may vary based on different device manufacturers and imaging platforms.
What to look for:
- Drusenoid PED, hyper-reflective foci, and reticular pseudodrusen are indicative of areas at high risk for developing atrophy7
- Loss of photoreceptor as well as RPE and choriocapillaris layer7
- Increase in choroidal hypertransmission indicative of atrophy7
- Drusen collapse is a precursor to atrophy8
Considerations:
- Cross-section needed for accurate recognition10
- Can provide early GA diagnosis11
- Scans are in high resolution11
- Challenges in image interpretation can lead to longer reading times12
Optical Coherence Tomography (OCT) en face and Near Infrared Reflectance (NIR)
If you do not have access to FAF imaging, OCT en face can be used as a substitute to visualize the full extent of GA lesions. On certain machines, NIR images can be acquired simultaneously with OCT en face images. Using both OCT en face and NIR scans allows for the highest accuracy in detecting RPE indicative of GA.7,13
Healthy OCT en face Image*
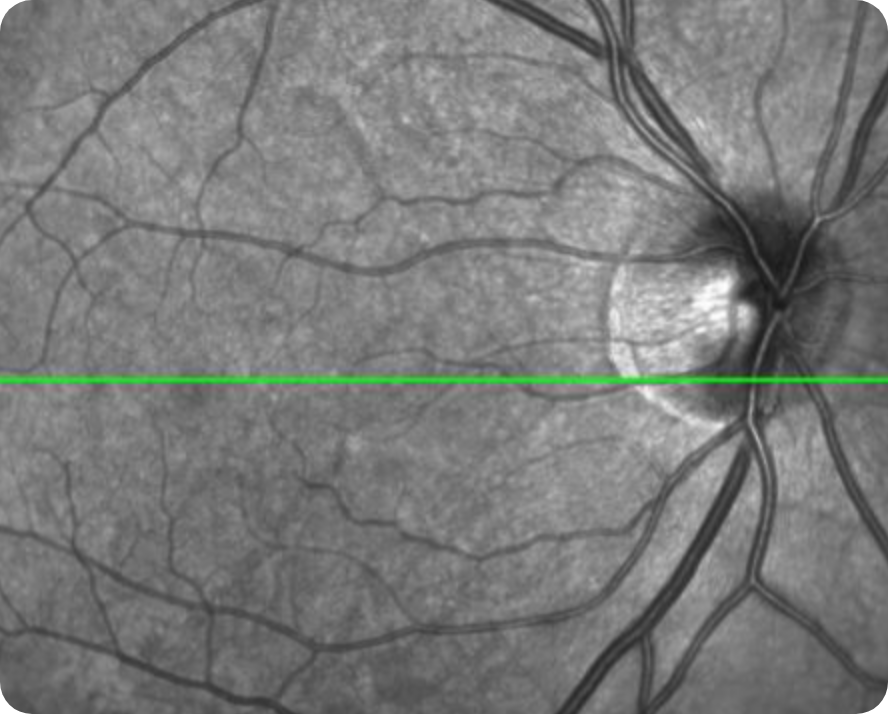
Image courtesy of Mohammad Rafieetary, OD, Charles Retina Institute.
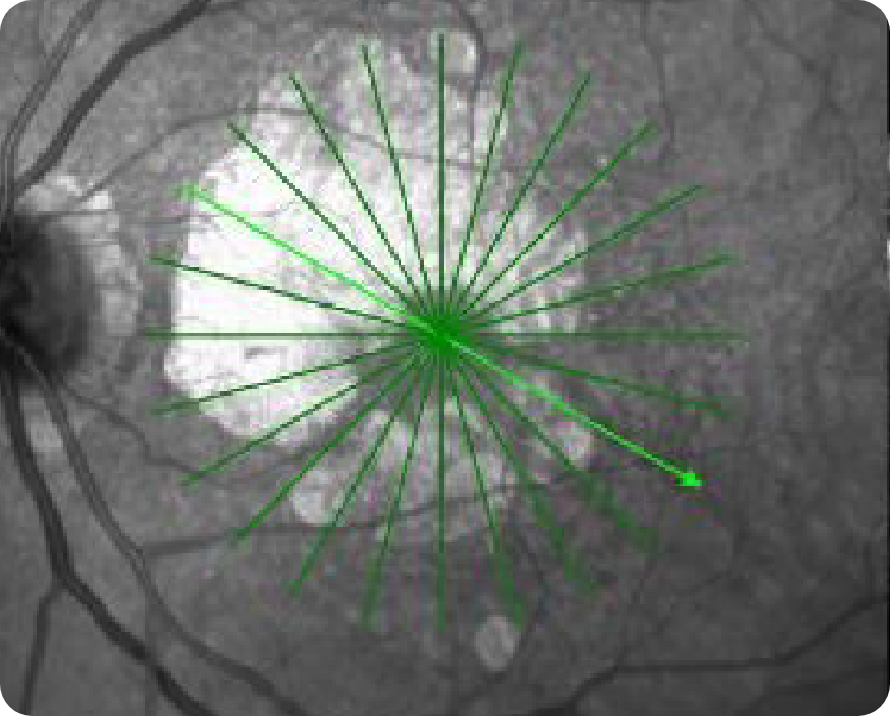
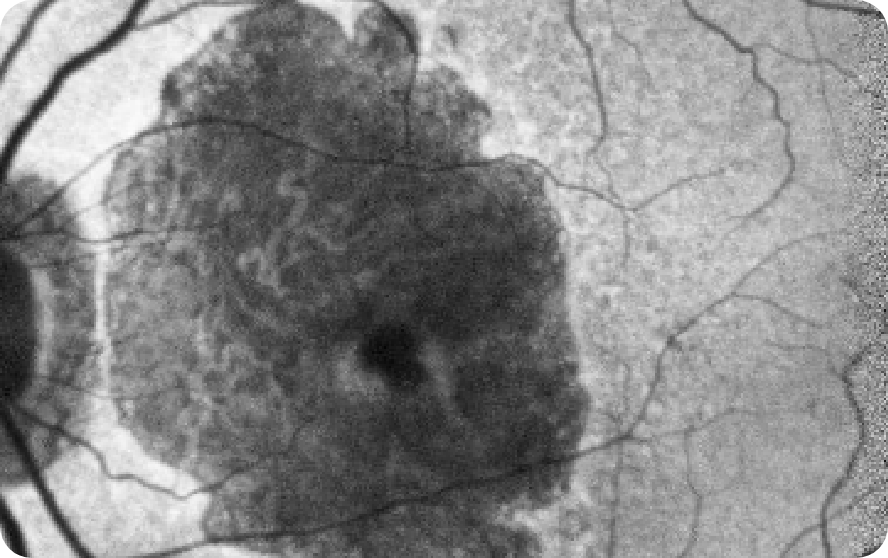
OCT en face Image 1
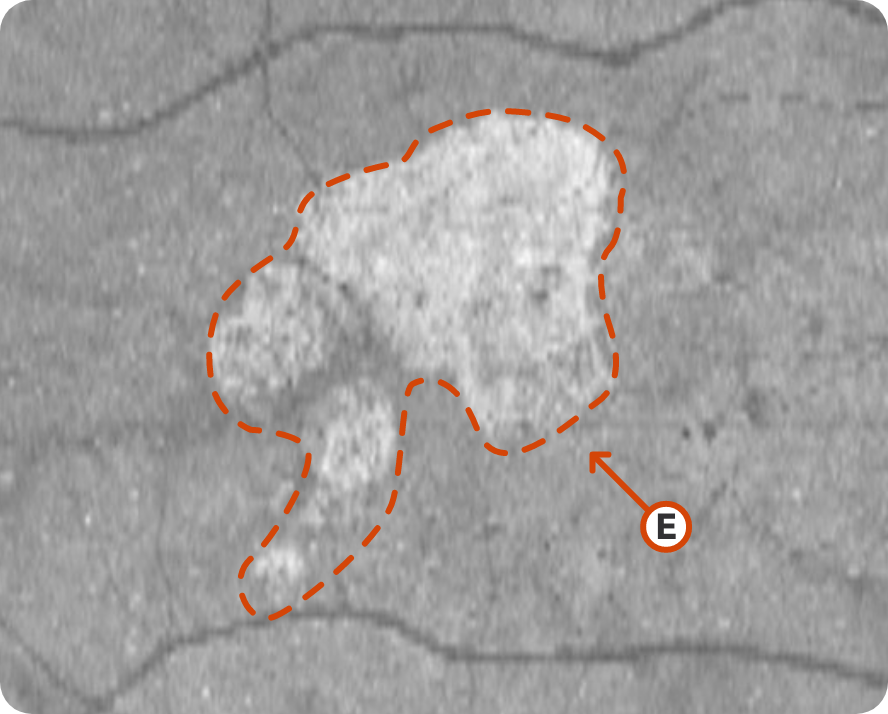
© 2019. This work is licensed under a CC BY 4.0 license. “Choriocapillaris flow impairment surrounding geographic atrophy correlates with disease progression”, "Figure 5D", Nassisi M, Baghdasaryan E, Borrelli E, et al. PLoS One.
Multifocal lesion appears as a bright area due to increased penetration of light into the choroid caused by RPE and outer retina atrophy14
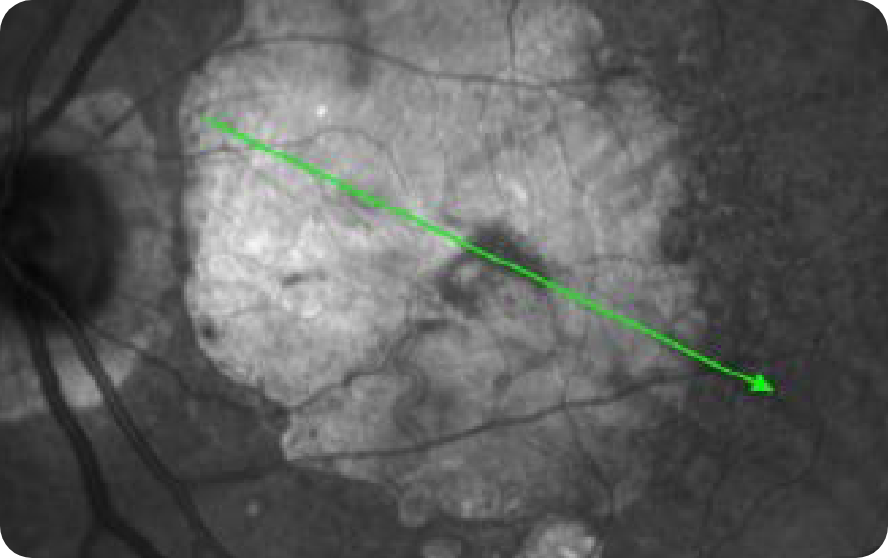
OCT en face Image 2
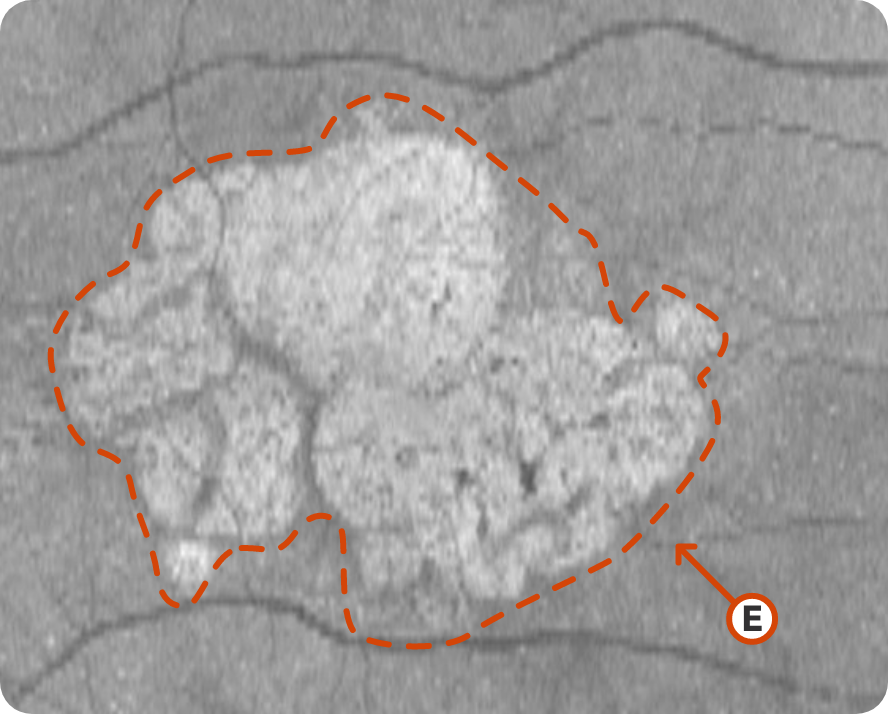
© 2019. This work is licensed under a CC BY 4.0 license. “Choriocapillaris flow impairment surrounding geographic atrophy correlates with disease progression”, "Figure 5E", Nassisi M, Baghdasaryan E, Borrelli E, et al. PLoS One.
Progression of larger multifocal lesion with subfoveal involvement14
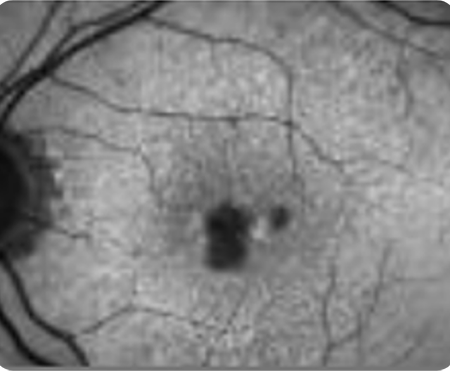
Healthy NIR Image
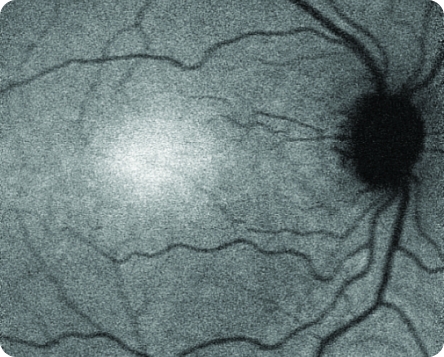
© 2021. This work is licensed under a CC BY 4.0 license. "Fundus autofluorescence and clinical applications", "Figure 2E", Pole C, Ameri H. JOVR [Internet].
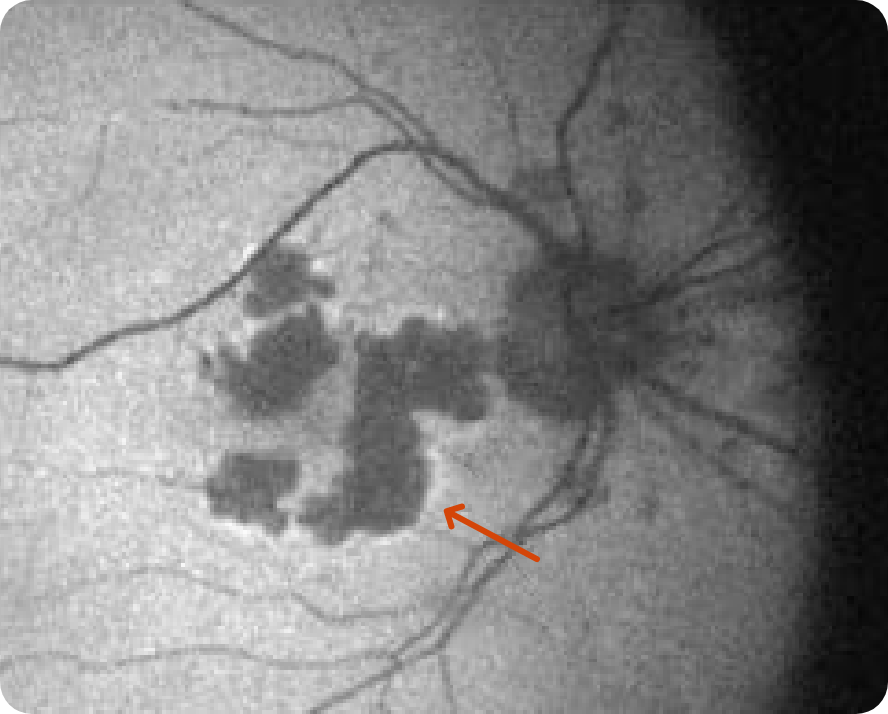
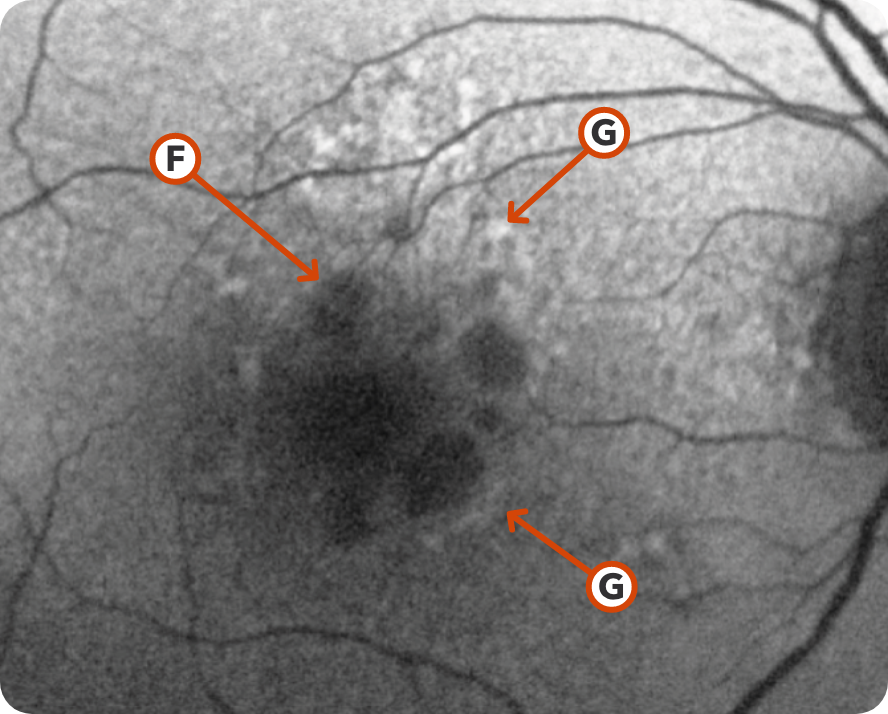
NIR Image 1
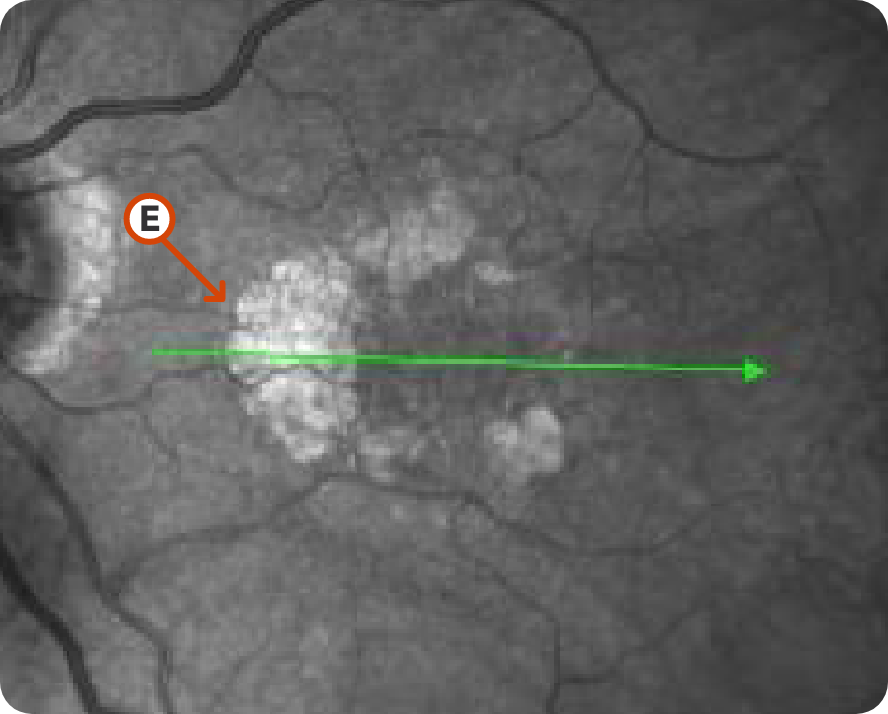
Image courtesy of Mohammad Rafieetary, OD, Charles Retina Institute.
Characteristic C-shaped lesion without subfoveal involvement15
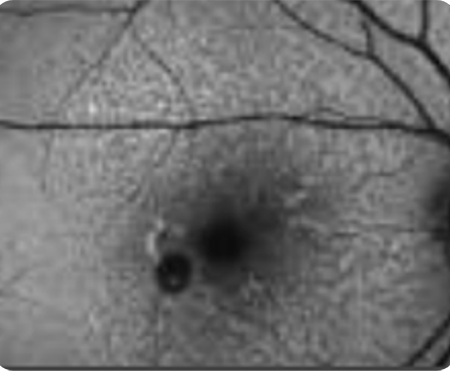
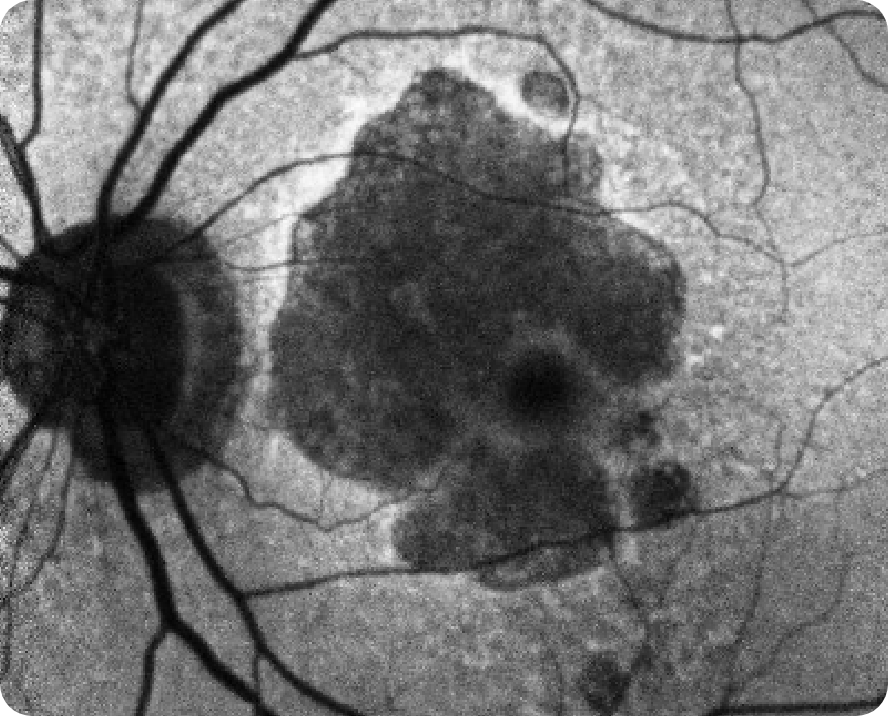
NIR Image 2
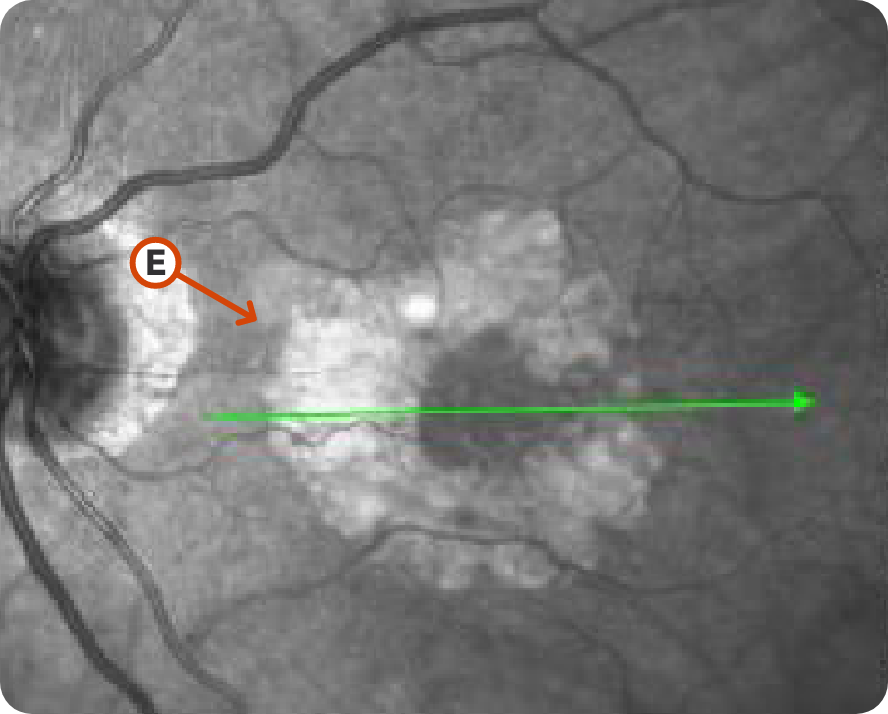
Image courtesy of Mohammad Rafieetary, OD, Charles Retina Institute.
Progression of lesion without subfoveal involvement15
Images may vary based on different device manufacturers and imaging platforms.
What to look for:
- Distinct borders, location, and size of lesion7,13
- Lesions appear hyperreflective on NIR and OCT en face images vs hyporeflective on FAF images7,13
Considerations:
- Allows for more comprehensive visualization of GA lesion borders in the absence of FAF7,10,12
- OCT en face images can guide you in selecting the proper cross-section for OCT B-scans6,7
- Interpretation dependent on imaging quality7
Fundus Autofluorescence (FAF)
Healthy FAF Image
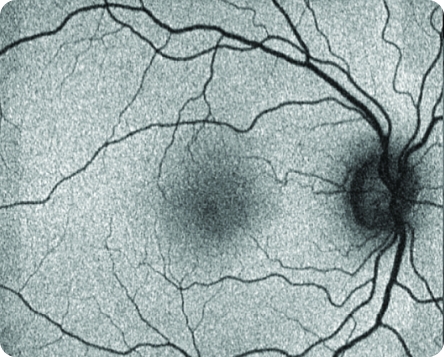
© 2021. This work is licensed under a CC BY 4.0 license. “Fundus autofluorescence and clinical applications”, "Figure 2B", Pole C, Ameri H. JOVR [Internet].
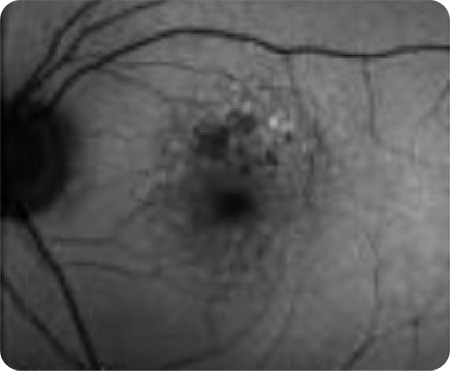
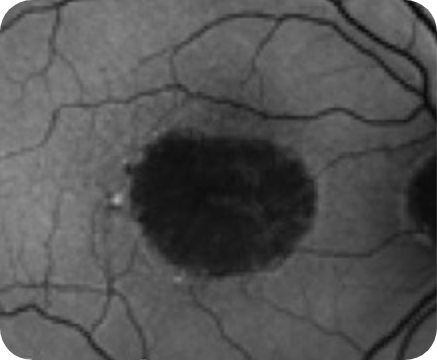
FAF Image 1
© 2021. This work is licensed under a CC BY 4.0 license. “Fundus autofluorescence and clinical applications”, "Figure 4", Pole C, Ameri H. J Ophthalmic Vis Res.
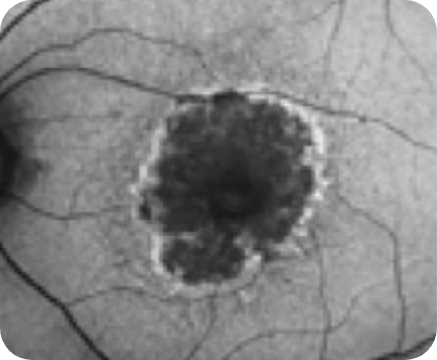
Areas of hypoautofluorescence showing multifocal lesion without subfoveal involvement7
Hyperautofluorescence indicating areas at high risk for atrophy7
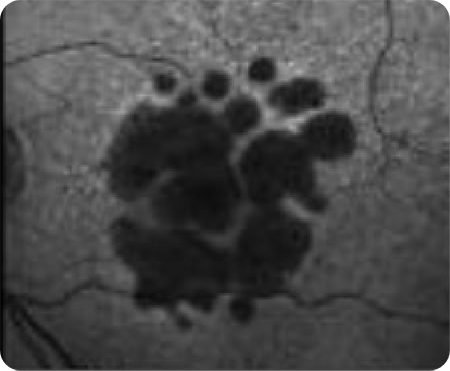
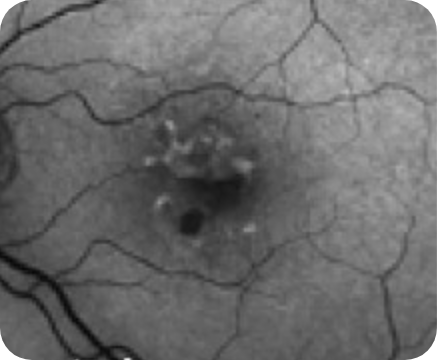
FAF Image 2
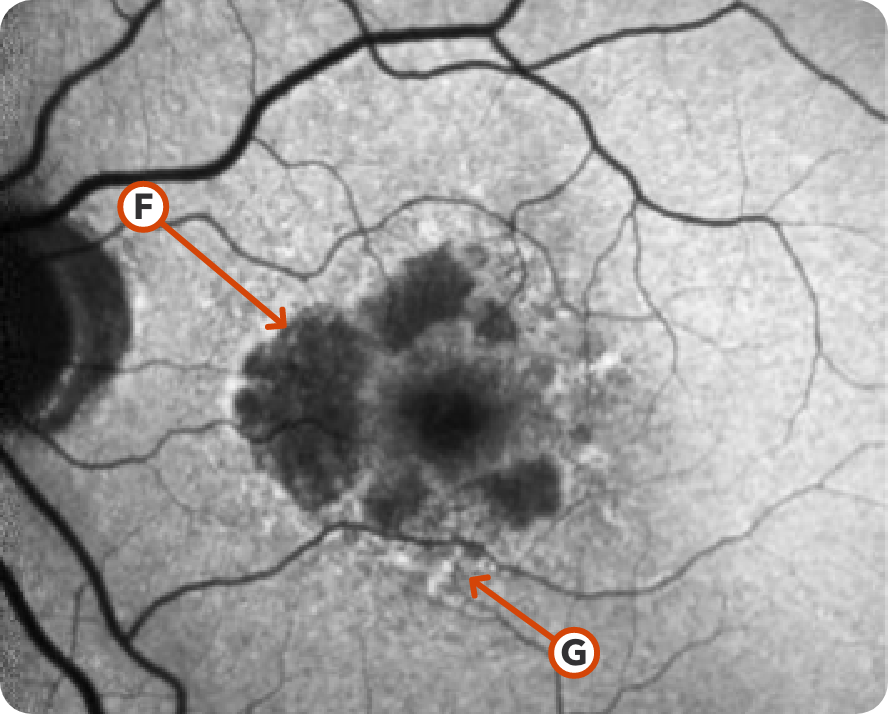
Image courtesy of Mohammad Rafieetary, OD, Charles Retina Institute.
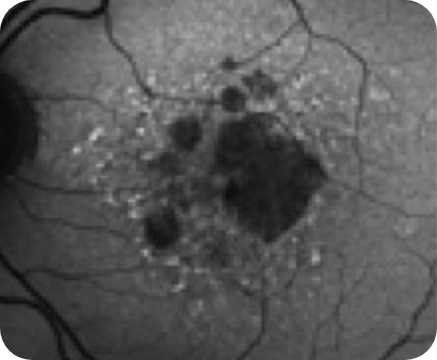
Hypoautofluorescence15
Hyperautofluorescence15
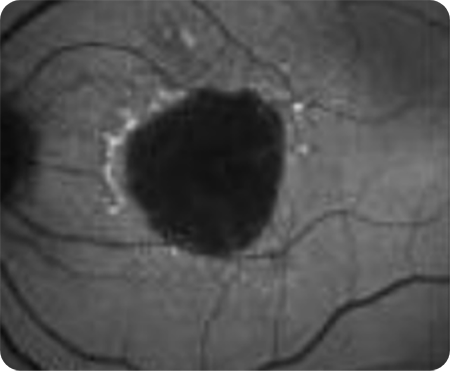
FAF Image 3
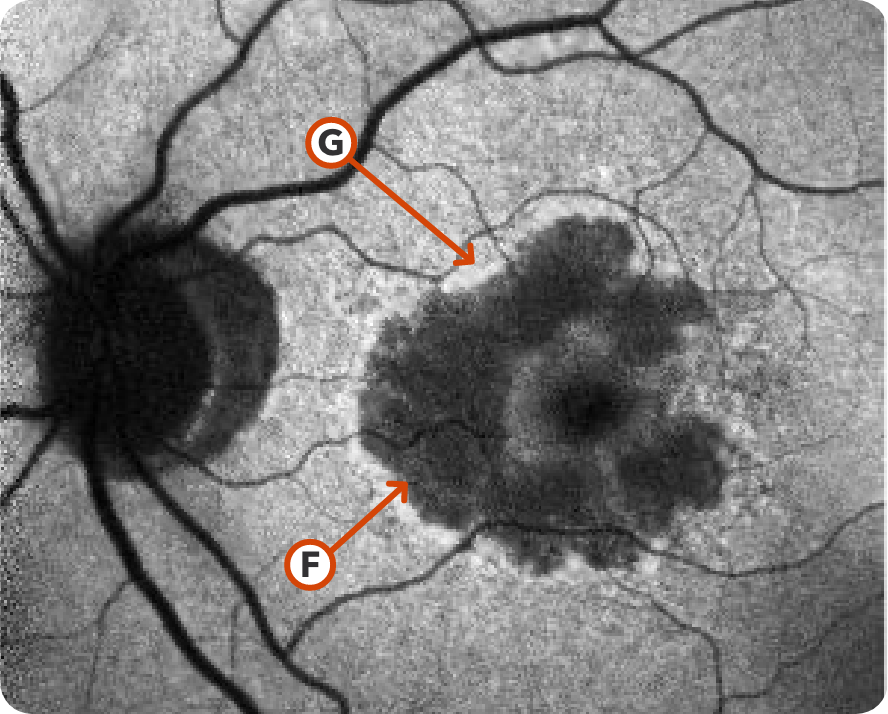
Image courtesy of Mohammad Rafieetary, OD, Charles Retina Institute.
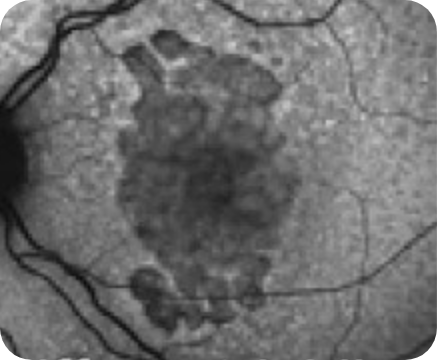
Hypoautofluorescence15
Hyperautofluorescence15
Images may vary based on different device manufacturers and imaging platforms.
What to look for:
- Depigmented, hypoautofluorescence in areas with atrophy7,16
- Abnormal hyperautofluorescent border that show areas of ongoing RPE cell dysfunction7,16
- A hyperfluorescent border is predictive of atrophic progression
- Hyperfluorescence indicates areas at high risk for atrophy
Considerations:
- Commonly used to assess both lesion size and the progression rate of GA12,17
-
Several risk factors associated with a higher GA progression rate can be seen on FAF, such as better visualization of7,12,17:
- Lesion size
- Focality of multifocal lesions
- Location without subfoveal involvement
- Pattern (eg, diffuse and banded)
- High contrast imaging makes the atrophy easier to detect12
- Can be challenging to identify atrophy in the fovea12
Color Fundus Photography (CFP)
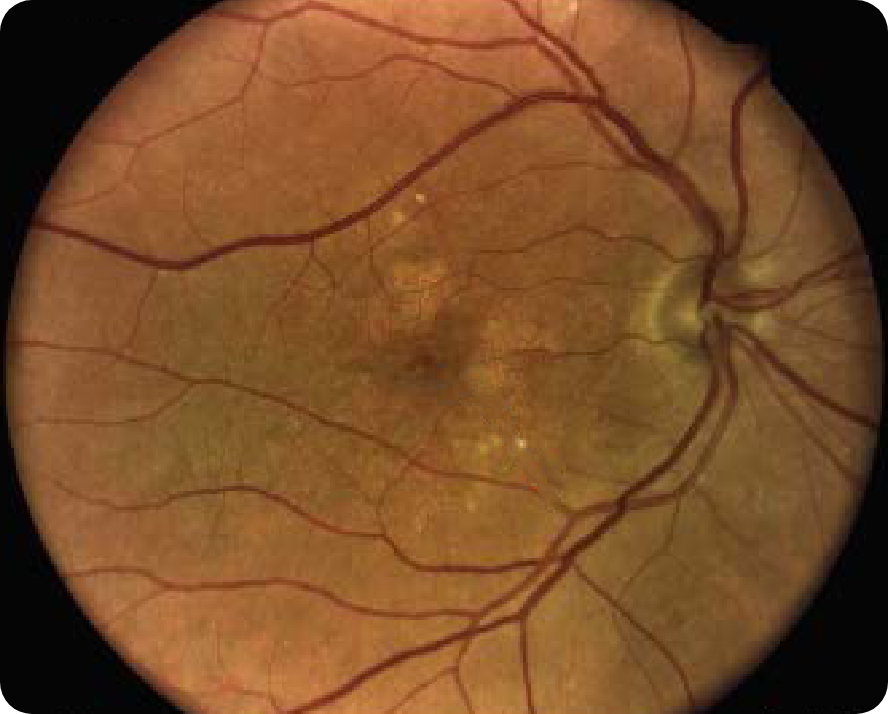
Healthy CFP Image
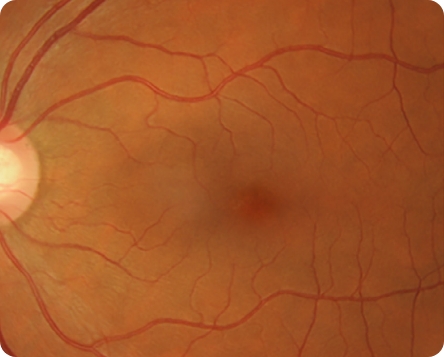
© 2016. This work is licensed under a CC BY 4.0 license. “Infrared reflectance imaging in age-related macular degeneration”, "Figure 1A", Ly A, Nivison-Smith L, Assaad N, Kalloniatis M. Ophthalmic Physiol Opt.
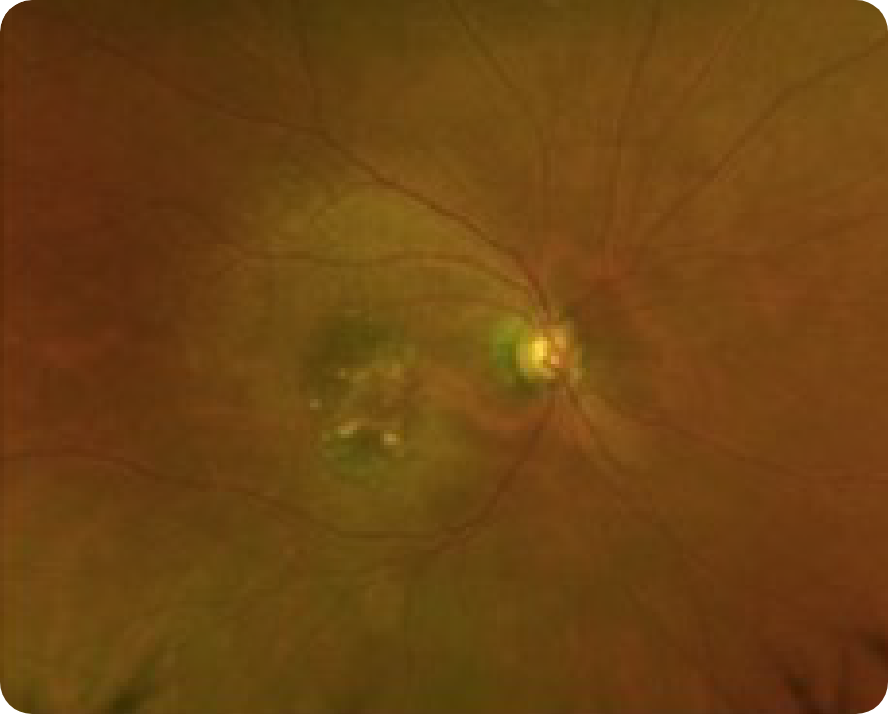
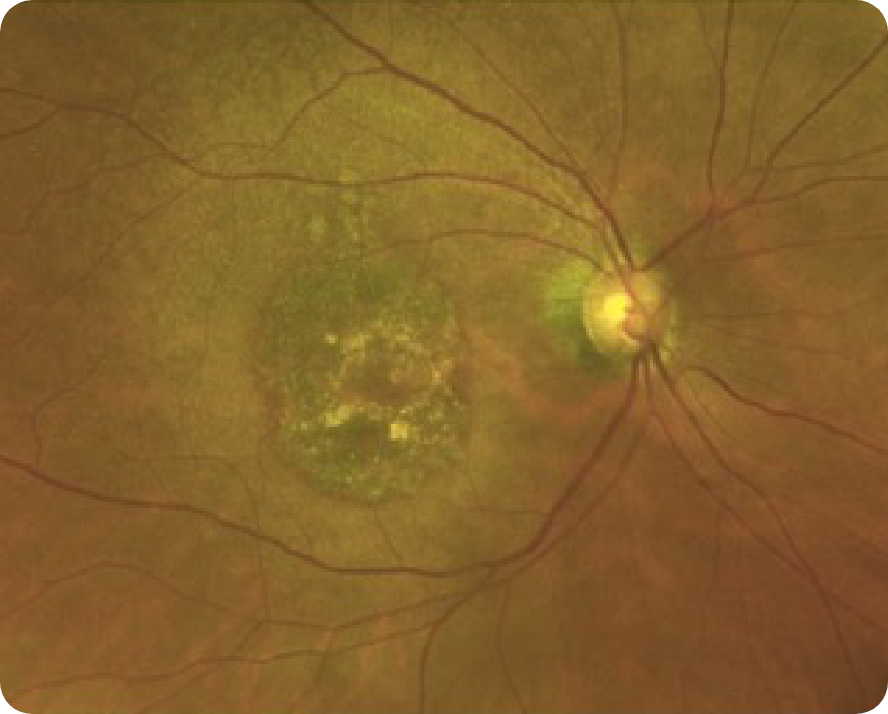
CFP Image 1
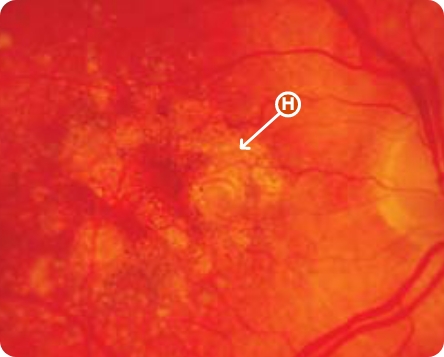
© 2012 Karger Publishers, Basel, Switzerland.
Area of atrophy8
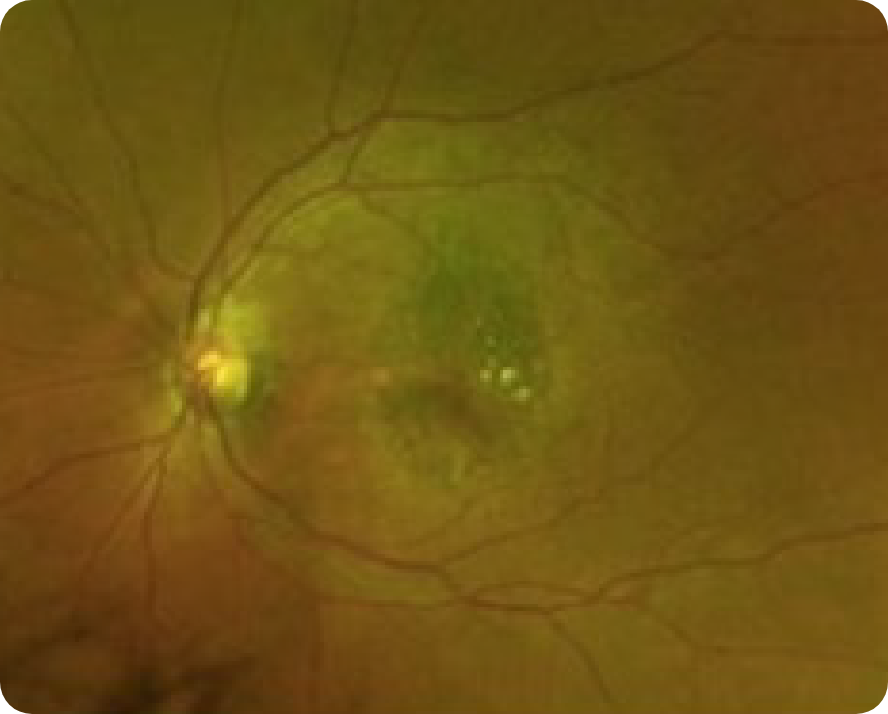
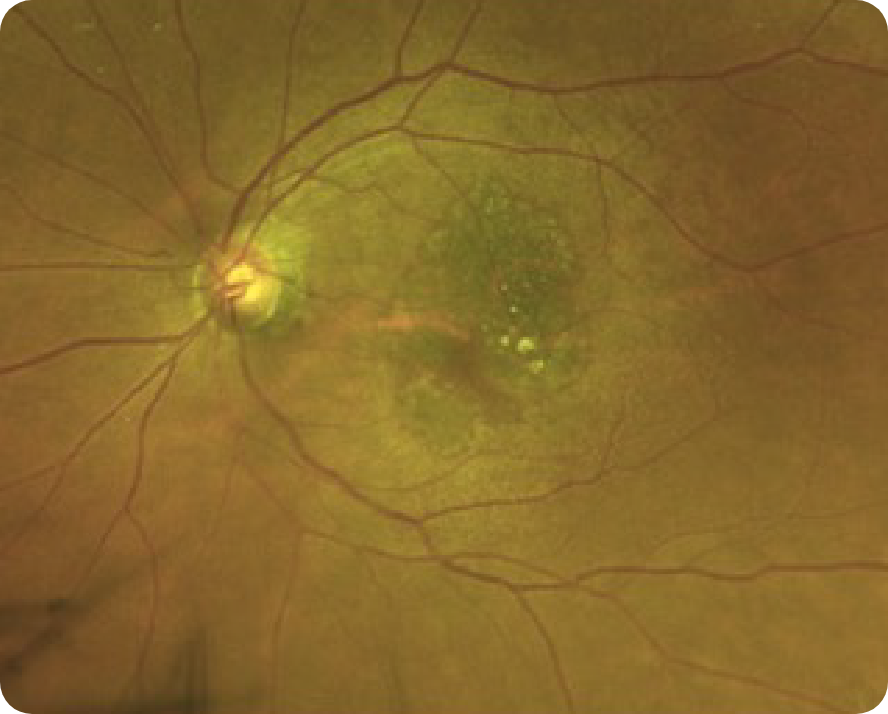
CFP Image 2
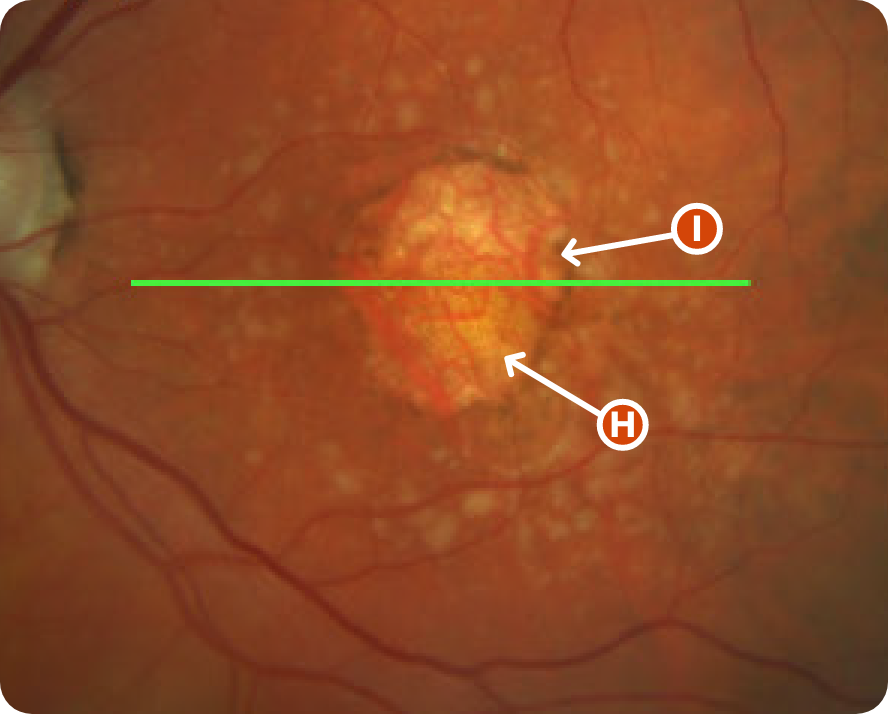
Reproduced from "Prognostic value of intermediate age-related macular degeneration phenotypes for geographic atrophy progression," Thiele S, Nadal J, Pfau M, et al, 2021;105(2):239-245, with permission from BMJ Publishing Group Ltd.
Area indicative of atrophy8
Choroidal vasculature8
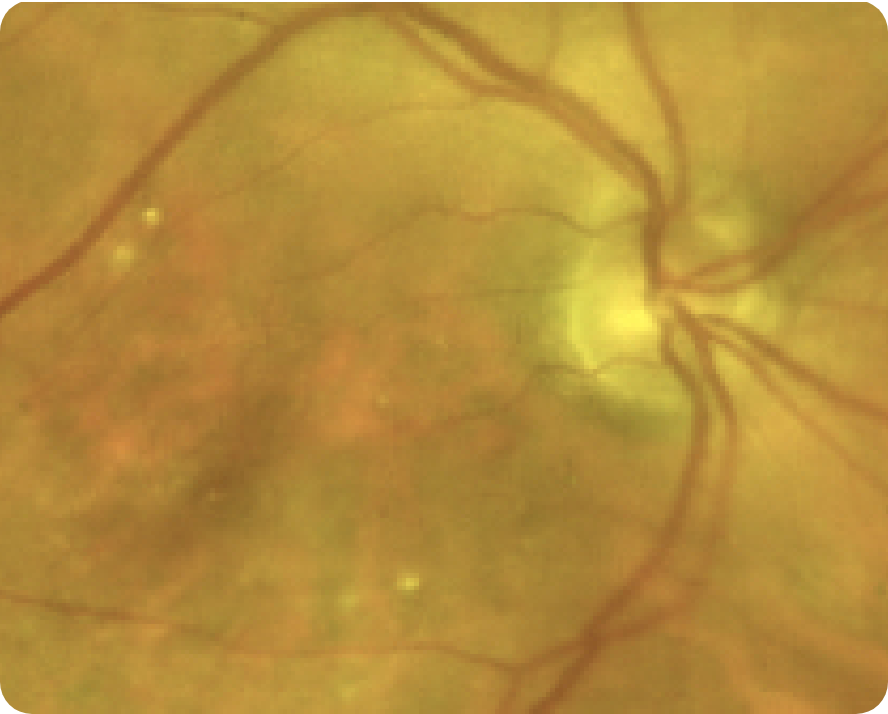
CFP Image 3
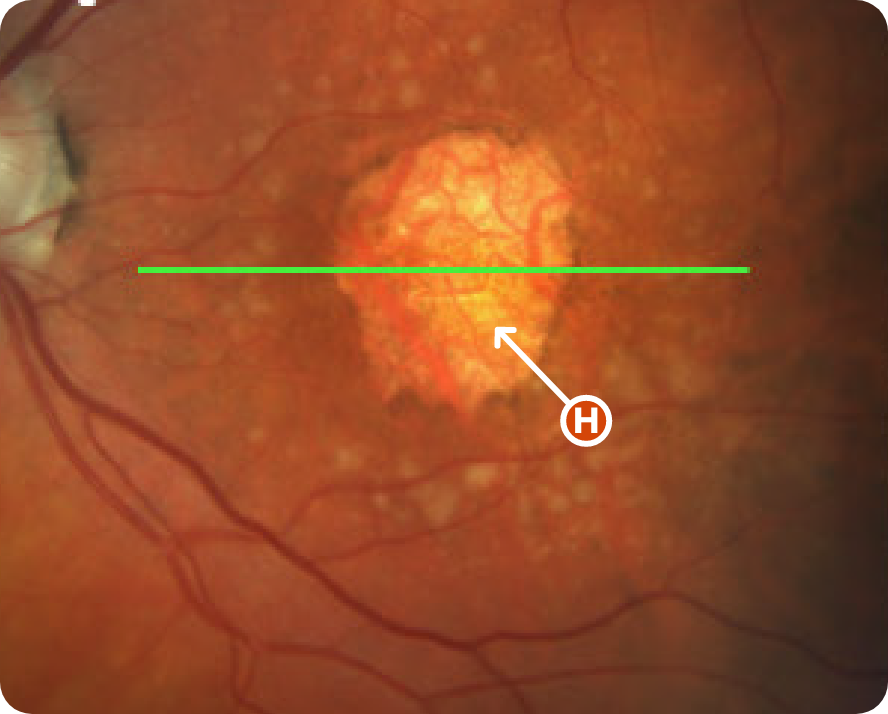
Reproduced from "Prognostic value of intermediate age-related macular degeneration phenotypes for geographic atrophy progression," Thiele S, Nadal J, Pfau M, et al, 2021;105(2):239-245, with permission from BMJ Publishing Group Ltd.
Area of atrophy8
Images may vary based on different device manufacturers and imaging platforms.
What to look for:
- Visible choroidal vasculature7
- Areas of hypopigmentation with sharply demarcated borders7
Considerations:
- Detects wide range of abnormalities12
- Difficult to detect subtle changes7
- CFP may show abnormalities that present similarly to GA, but are not GA. It is important to use multimodal imaging and a holistic assessment to properly diagnose7,12,18
- Limited ability to assess full extent of lesion progression (may underestimate the size of the lesion)7,18
- May not exhibit many lesion characteristics associated with disease progression due to reduced contrast7,12